ReMapEnrich
ReMapEnrich is a R-software package to identify significantly enriched regions from ReMap catalogues or user defined catalogues. ReMapEnrich provide functions to import any in-house catalogue, automate and plot the enrichment analysis for genomic regions.
ReMapEnrich
Bioinformatics tools to compute statistical enrichment of geonomic regions within ReMap catalogue or any other catalogue of peaks.
About
Current next generation sequencing studies generate a large variety of genomic regions ranging from regulatory regions with transcription factors or histone marks ChIP-seq to variant calls or coding/non-coding transcripts. Also, the number of complex catalogues from large-scale integrative efforts are increasing and large sequencing projects. To facilitate the interpretation of functional genomics, epigenomics and genomics data we have developed a R-software package ReMapEnrich to identify significantly enriched regions from user defined catalogues. ReMapEnrich provide functions to import any in-house catalogue, automate and plot the enrichment analysis for genomic regions.
Getting Started
These instructions will get you a copy of the project up and running on your local machine for development and testing purposes. See deployment for notes on how to deploy the project on a live system.
Dependencies
Here are dependencies used in our package. Build will prompt for installation.
R.utils, data.table, RMySQL, GenomicRanges
Install the ReMapEnrich R-package from GitHub
To install a R package, start by installing the devtools package from CRAN.
install.packages("devtools")
Install the ReMapEnrich R-package from GitHub using the following code, where you need to remember to list both the author and the name of the package
library(devtools)
install_github("remap-cisreg/ReMapEnrich")
Installing GitHub packages into RStudio
Although RStudio does have various tools for installing packages, the most straightforward approach is to download the zipped file, open the ReMapEnrich.Rpoject file, and in Rstudio Build -> Install and Restart.
Or just follow the steps described in the previous section, entering the code into the Console in RStudio.
Using ReMapEnrich
Basic use
This example is based on small dataset (input and catalog) released with the ReMapEnrich package. It will go through various steps : loading data, computing enrichments, visualizing results.
Please read Basic use documentations, and plot examples.
Advanced use
Here we will be discovering more advanced functions and possibilities of the ReMapEnrich package. You may want to read the basics functions first in order to understand the principles of enrichment analysis.
Please read Advanced use documentations, and universe usage.
Quick Enrichement Code - no fuzz
Please read Basic use and Advanced use for full documentations of ReMapEnrich functionalities.
Load the ReMapEnrich library
library(ReMapEnrich)
Load the example dataset
query <- bedToGranges(system.file("extdata",
                                  "ReMap_nrPeaks_public_chr22_SOX2.bed",
                                  package = "ReMapEnrich"))
Load the ReMap catalogue
# Create a local directory
demo.dir <- "~/ReMapEnrich_demo"
dir.create(demo.dir, showWarnings = FALSE, recursive = TRUE)

# Use the function DowloadRemapCatalog
remapCatalog2018hg38 <- downloadRemapCatalog(demo.dir)

# Load the ReMap catalogue and convert it to Genomic Ranges
remapCatalog <- bedToGranges(remapCatalog2018hg38)
Compute enrichment
The basic way to compute an enrichment is to run with default parameters. - no universe - single core - Default shuffling - defautl overlaps. Please read Basic use vignette for more documentations
enrichment.df <- enrichment(query, remapCatalog, byChrom = TRUE)
# The option byChrom is set to TRUE as we are only working on one chromosome for this analysis.
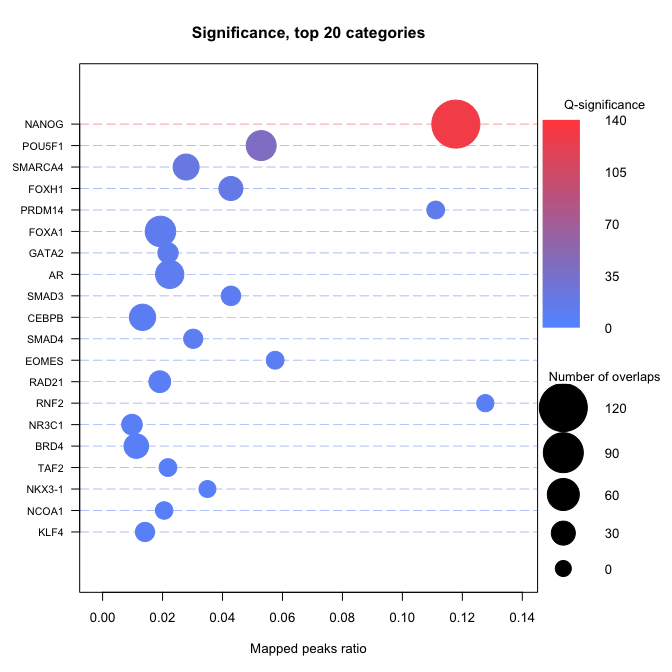
Plot the enriched TFs
Here we display a dot plot. Please read Basic use and Advanced use for more documentations
enrichmentDotPlot(enrichment.df)
Authors
- Zacharie Menetrier - ChienBleu
- Martin Mestdagh - MartinMestdagh
- Jacques van Helden - jvanheld
- Laurent Tichit - Laulo
- Benoit Ballester - benoitballester
License
This project is licensed under the MIT License - see the LICENSE.md file for details
Acknowledgments
We are grateful to Aurélien Griffon and Quentin Barbier for their very early contributions to this project.